先说一句招黑的话:python是最好的编程语言!
没有之一
近来一直在学python,
最先知道python可以做爬虫,简单几行代码,轻松爬取网站的内容
上手也比较快,即学即上岗
python真是无所不能呀,越来越被人重视,现在是引用这张经典照片的时候了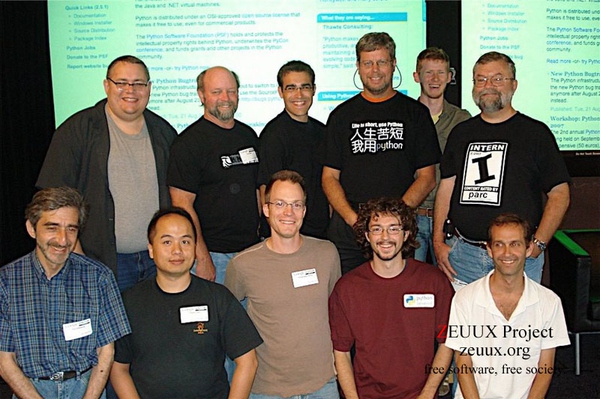
比如现在使用Arcpy写一写批处理的脚本,解决很多繁琐的问题
还有爬虫,将爬到的数据分析一下,很有成就感
++++++++++++++++++++++++++++++++++++++++++++++++++++++++++++++++++++
过年放假前,接到一项挑战:将公司论坛网站(ArcGIS知乎)服务器上的Apach日志分析一下,看看网站论坛的搜索情况
日志是每天生成一个,一共是二百多天的,总共大概1.3个G,数量不大。
读取数据 每天搜索次数统计
1、首先肯定是看一下这些文件名字,嗯,很正规,方便后续的读取和存储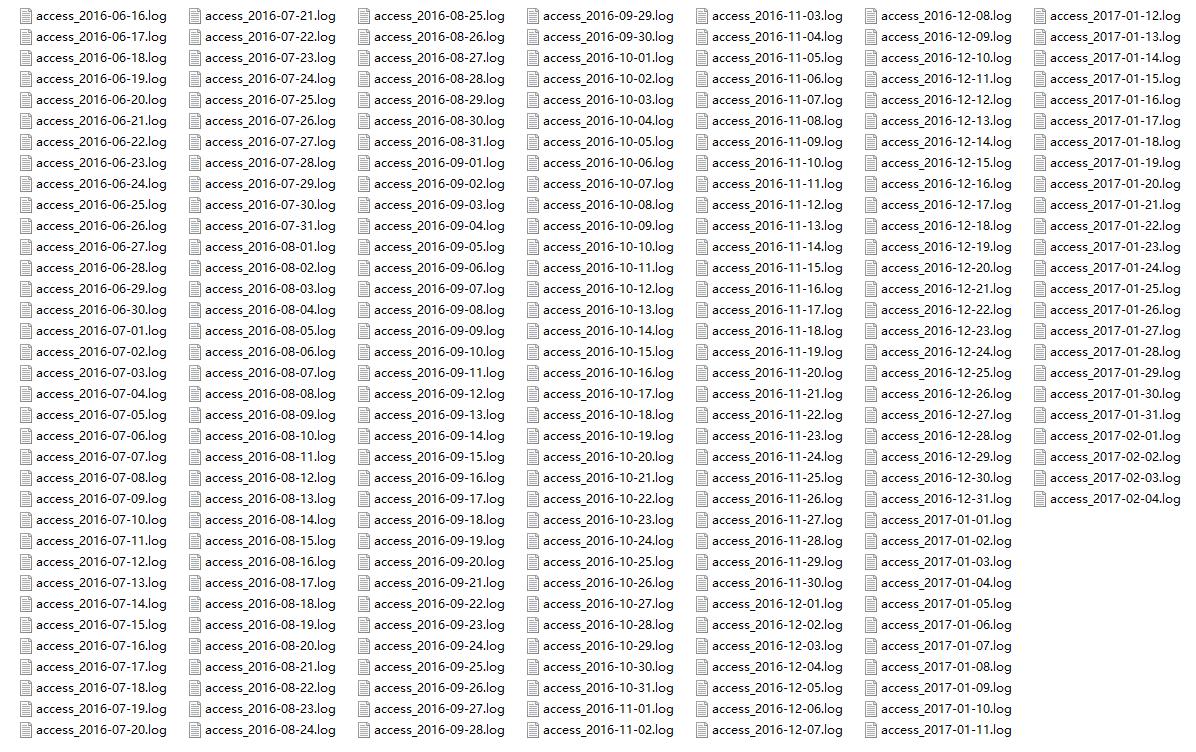
2、然后随便打开一个文件,分析一下存储结构,
然后找到自己需要的内容,初步思考怎么提取出来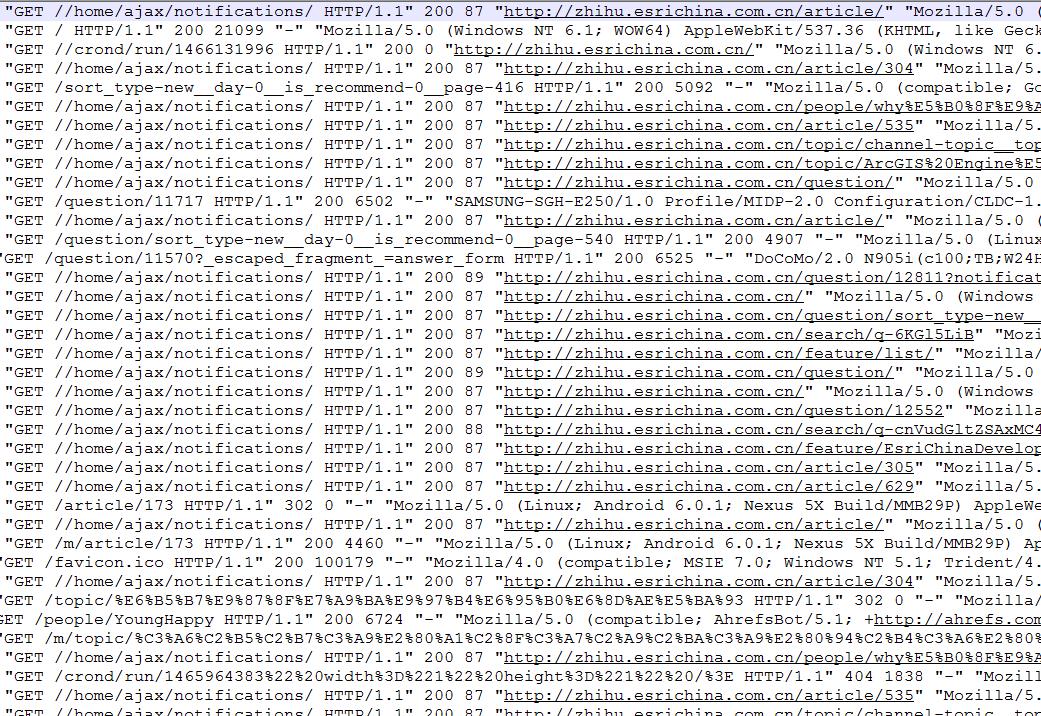
3、接着尝试写代码读取一个文件看看,无压力
4、现在要的是将里面有形如“GET //search/ajax/search_result/search_type-questions__q-%E5%85%A5%E9%97%A8”搜索的请求行取出来,找到其中q-%E5%85%A5%E9%97%A8字符串,
然后使用“urllib.parse.unquote”转码,转为可以读懂的关键词,这就是要的结果了
5、读取到每个日志文件中的关键词后,将其存储到文本中,代码如下,
1 | ###读取源数据,通过挑选、反编码并写入内存 |
PS:读取完文件花了10S
同一IP、日期、搜索关键词结果去重
好了,得到初步结果。
通过代码,可以看到:每天搜索次数统计.txt中包含了三方面的内容:IP,时间,搜索关键词,
对于同一IP,同一时间,同一搜索关键词进行去重,得到清洗后的数据源,才能进行后续的有效分析
代码如下
1 | '''同一IP、日期、搜索关键词结果去重''' |
搜索关键词Top100统计
有了数据能做些什么呢?
既然是网站论坛的搜索关键词统计,那么统计一下搜索次数最高的关键词 TOP100!
python很容易上手,那么问题来了:你将对Python的了解不够深入。
所以在你开始实现自己的想法时,一种“朴素的编程思想”贯穿脑中,费尽心力写了几十行,还不怎么完美
最后发现该功能已经写成函数了,你只需用一行去调用即可。
这里不禁感叹python的强大:没有做不到的,只有你想不到的。
好吧,这是我的心得体会!
附上统计Top100的代码
1 | '''搜索关键词Top100统计''' |
按月份统计搜索次数
有了每天的搜索次数,就可以得到每月的搜索次数
1 | '''按月份统计汇总''' |
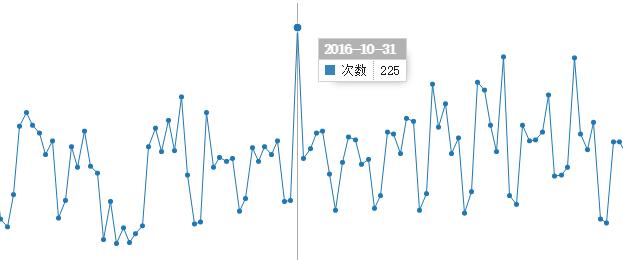
统计结果成图
得到统计结果后,可以通过python的matplotlib等库可视化数据
1 | '''每天统计成图''' |
1 | '''每月统计折点图''' |
1 | '''top20成图''' |
1 | '''top20成图''' |
由于上述都是以txt文档的形式保存数据,为方便出图,可以转成Excel格式,实现代码如下
1 | def txt_to_xlsx(txtpath): |
到这,代码运行无误的话,数据分析结果已经得到
如果我进一步想将分析的结果以邮件的形式发送给别人,可以用下面的代码实现
1 | _user = "发送人邮箱地址" |

如果想知道运行这些过程消耗的时间,可以在最后加上以下代码
1 | '''执行操作时间''' |
最后的最后,如果你觉得每天的统计次数成图效果不好,可以制作一个HTML网页去展示,调用js的C3库,易于交互查看